
SQL Server Health Check Toolkit
A collection of T-SQL and PowerShell scripts that check CPU, memory, wait statistics, blocking, backups, and Availability Group health on SQL Server instances.
Repository link coming soon
Problem Statement
Production SQL Server incidents are easier to prevent than to firefight. Checking CPU pressure, memory usage, wait statistics, blocking, deadlocks, backup health, database growth, and Availability Group status by hand across many instances is slow and easy to forget under pressure. This toolkit collects the checks I run most often into a repeatable set of scripts instead of one-off queries copied from old email threads.
Architecture
Technologies Used
- T-SQL scripts against DMVs and system catalog views for CPU, memory, wait stats, and blocking.
- PowerShell wrapper scripts to schedule checks and format output.
- SQL Agent jobs for unattended scheduling across instances.
- Always On Availability Group DMVs for HA/DR health checks.
SQL Waits Dashboard
The scripts above are what I reach for during an actual incident, but wait statistics are also the
metric I want to see before things get bad enough to page anyone. So I built a small web
dashboard on top of the same wait-stats checks: a FastAPI backend that queries
sys.dm_os_wait_stats, sys.dm_exec_requests, sys.dm_os_schedulers, and related DMVs across one
or more registered SQL Server instances, paired with a React front end that turns the raw wait
types into charts, a signal-wait/CPU-pressure indicator, and plain-English recommendations instead
of a results grid I have to squint at.
Dashboard Architecture
The backend supports multiple registered connections at once (each with its own saved server, port, database, auth mode, and driver), so I can flip between environments without re-entering connection details every time. Wait types get grouped into categories - CPU, IO, Lock, Memory, Network, and so on - and a signal-wait percentage is computed to flag CPU pressure: when a large share of wait time is signal wait (waiting for a CPU, not a resource) rather than resource wait, that's a scheduler/CPU problem, not an IO or locking one.
What it looks like
Screenshots below use a placeholder IP and demo credentials - this runs against internal SQL Server instances in practice.
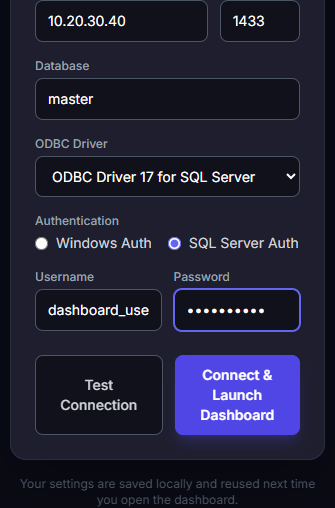
Connection setup - register a server (server/port/database, ODBC driver, Windows or SQL auth), test the connection, and save it:
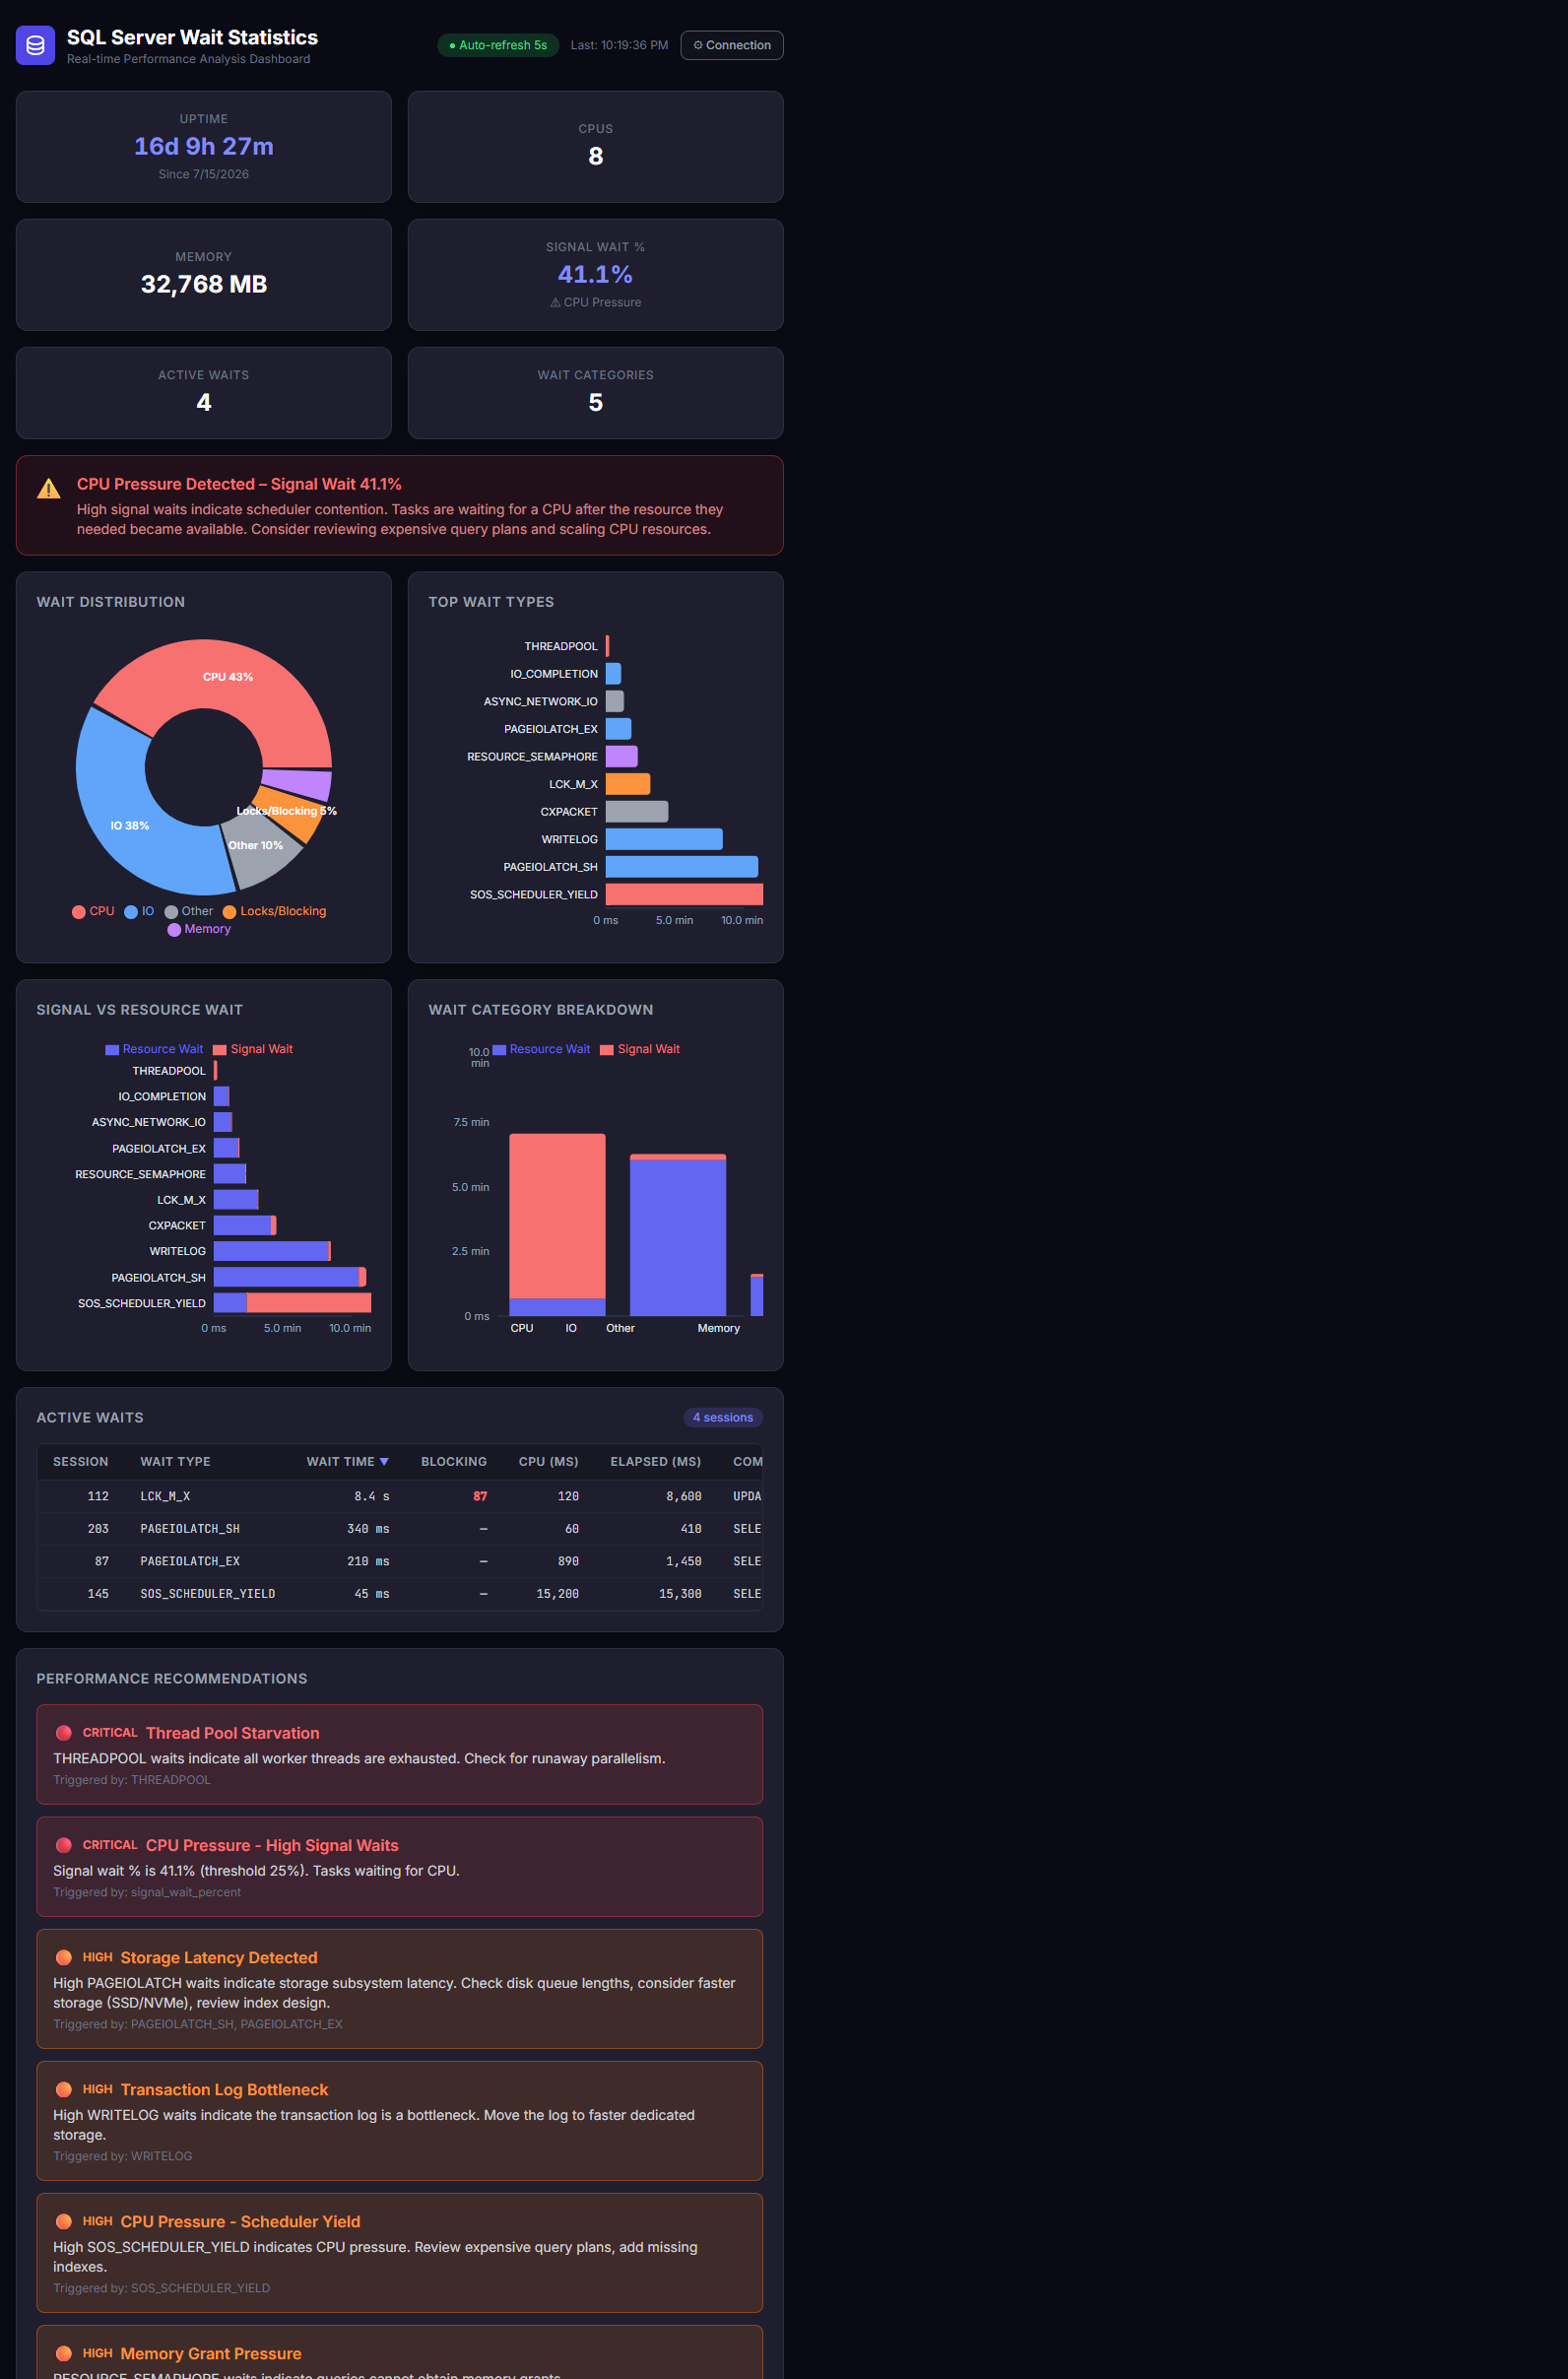
Dashboard overview - uptime, CPU count, memory, signal wait %, and active/wait-category counts up top, a CPU-pressure banner when signal waits run hot, wait-distribution and wait-type charts, an active waits table, and a recommendations panel that turns the raw numbers into "here's what to actually look at":
Recommendation engine
Rather than just plotting numbers, the dashboard runs the computed stats through a set of threshold-based rules and surfaces them as severity-tagged cards - things like thread pool starvation, CPU pressure from high signal waits or scheduler yields, storage latency from IO waits, transaction log bottlenecks, and memory grant pressure. The goal is the same one behind the rest of this toolkit: turn "here are some DMV numbers" into "here's the one thing worth checking first."
Lessons Learned
Consolidating checks into one toolkit made it much faster to triage "is the server actually struggling, or does it just feel slow" during incidents. The biggest lesson was resisting the urge to over-automate every possible metric - a focused set of checks that map directly to common incident causes (blocking, wait stats, backup failures) is more useful day-to-day than a huge dashboard nobody reads under pressure.